For more information or if you need help retrieving your data, please contact Weights & Biases Customer Support at support@wandb.com
An overview of how modern quant research is shifting toward large-scale AI agents, and why GPU-native infrastructure, unified scheduling, and rigorous experiment tracking are becoming foundational to turning exploration into deployable trading systems. In this report, we explore how Weights & Biases helps quant researchers manage complex workflows and how CoreWeave can power the compute behind these next-generation trading systems.
Quantitative trading is evolving. Where once the focus was on chasing tiny, millisecond-level edges, modern strategies now aim to understand broader market structure over seconds to minutes. This shift has been fueled by advances in AI and ML, which enable researchers and traders to model complex patterns, test hypotheses at scale, and rigorously track experiments. Developing and deploying these strategies end-to-end requires robust infrastructure, from high-performance compute for large-scale experimentation to tools that ensure reproducibility and observability.
When quant strategies move from micro-scale latency games to modeling market structure over seconds and minutes, the entire research pipeline gets heavier. You stop dealing with a few hand-crafted signals and start working with massive datasets, event-driven simulations, replay engines, and AI models that need to be trained, fine-tuned, and stress-tested across hundreds of scenarios. That requires serious GPU clusters that can spin up fast, scale to dozens or hundreds of GPUs, run distributed training jobs, and execute full market replays without bottlenecks.
CoreWeave Cloud is purpose-built for GPU-intensive AI workloads, providing GPU-dense infrastructure with bare-metal performance, fast provisioning, and high-bandwidth interconnects. For a quant team running thousands of ML experiments, reinforcement-learning agents, or event-driven simulations, this specialized infrastructure lets you iterate at a scale and pace that general-purpose cloud infrastructure struggles to support.
But enormous compute power only matters if you can keep track of what you are actually doing. Once models evolve, datasets are regenerated, simulation parameters shift, and agents behave differently across regimes, the research surface area explodes. At that point, simply plotting a few loss curves is no longer enough. You need a persistent record of what ran, with which data, under which assumptions, and how it behaved over time, across markets, and across parameter sweeps.
This is the role Weights & Biases fills. It is a system for recording the full state of an experiment, not just its outputs. Each run is logged with configuration, dataset versions, code references, metrics, artifacts, and intermediate results, all stored centrally and indexed. Instead of having experiment context scattered across log directories and machines, everything lives in one place where runs can be compared, queried, and traced back months later.

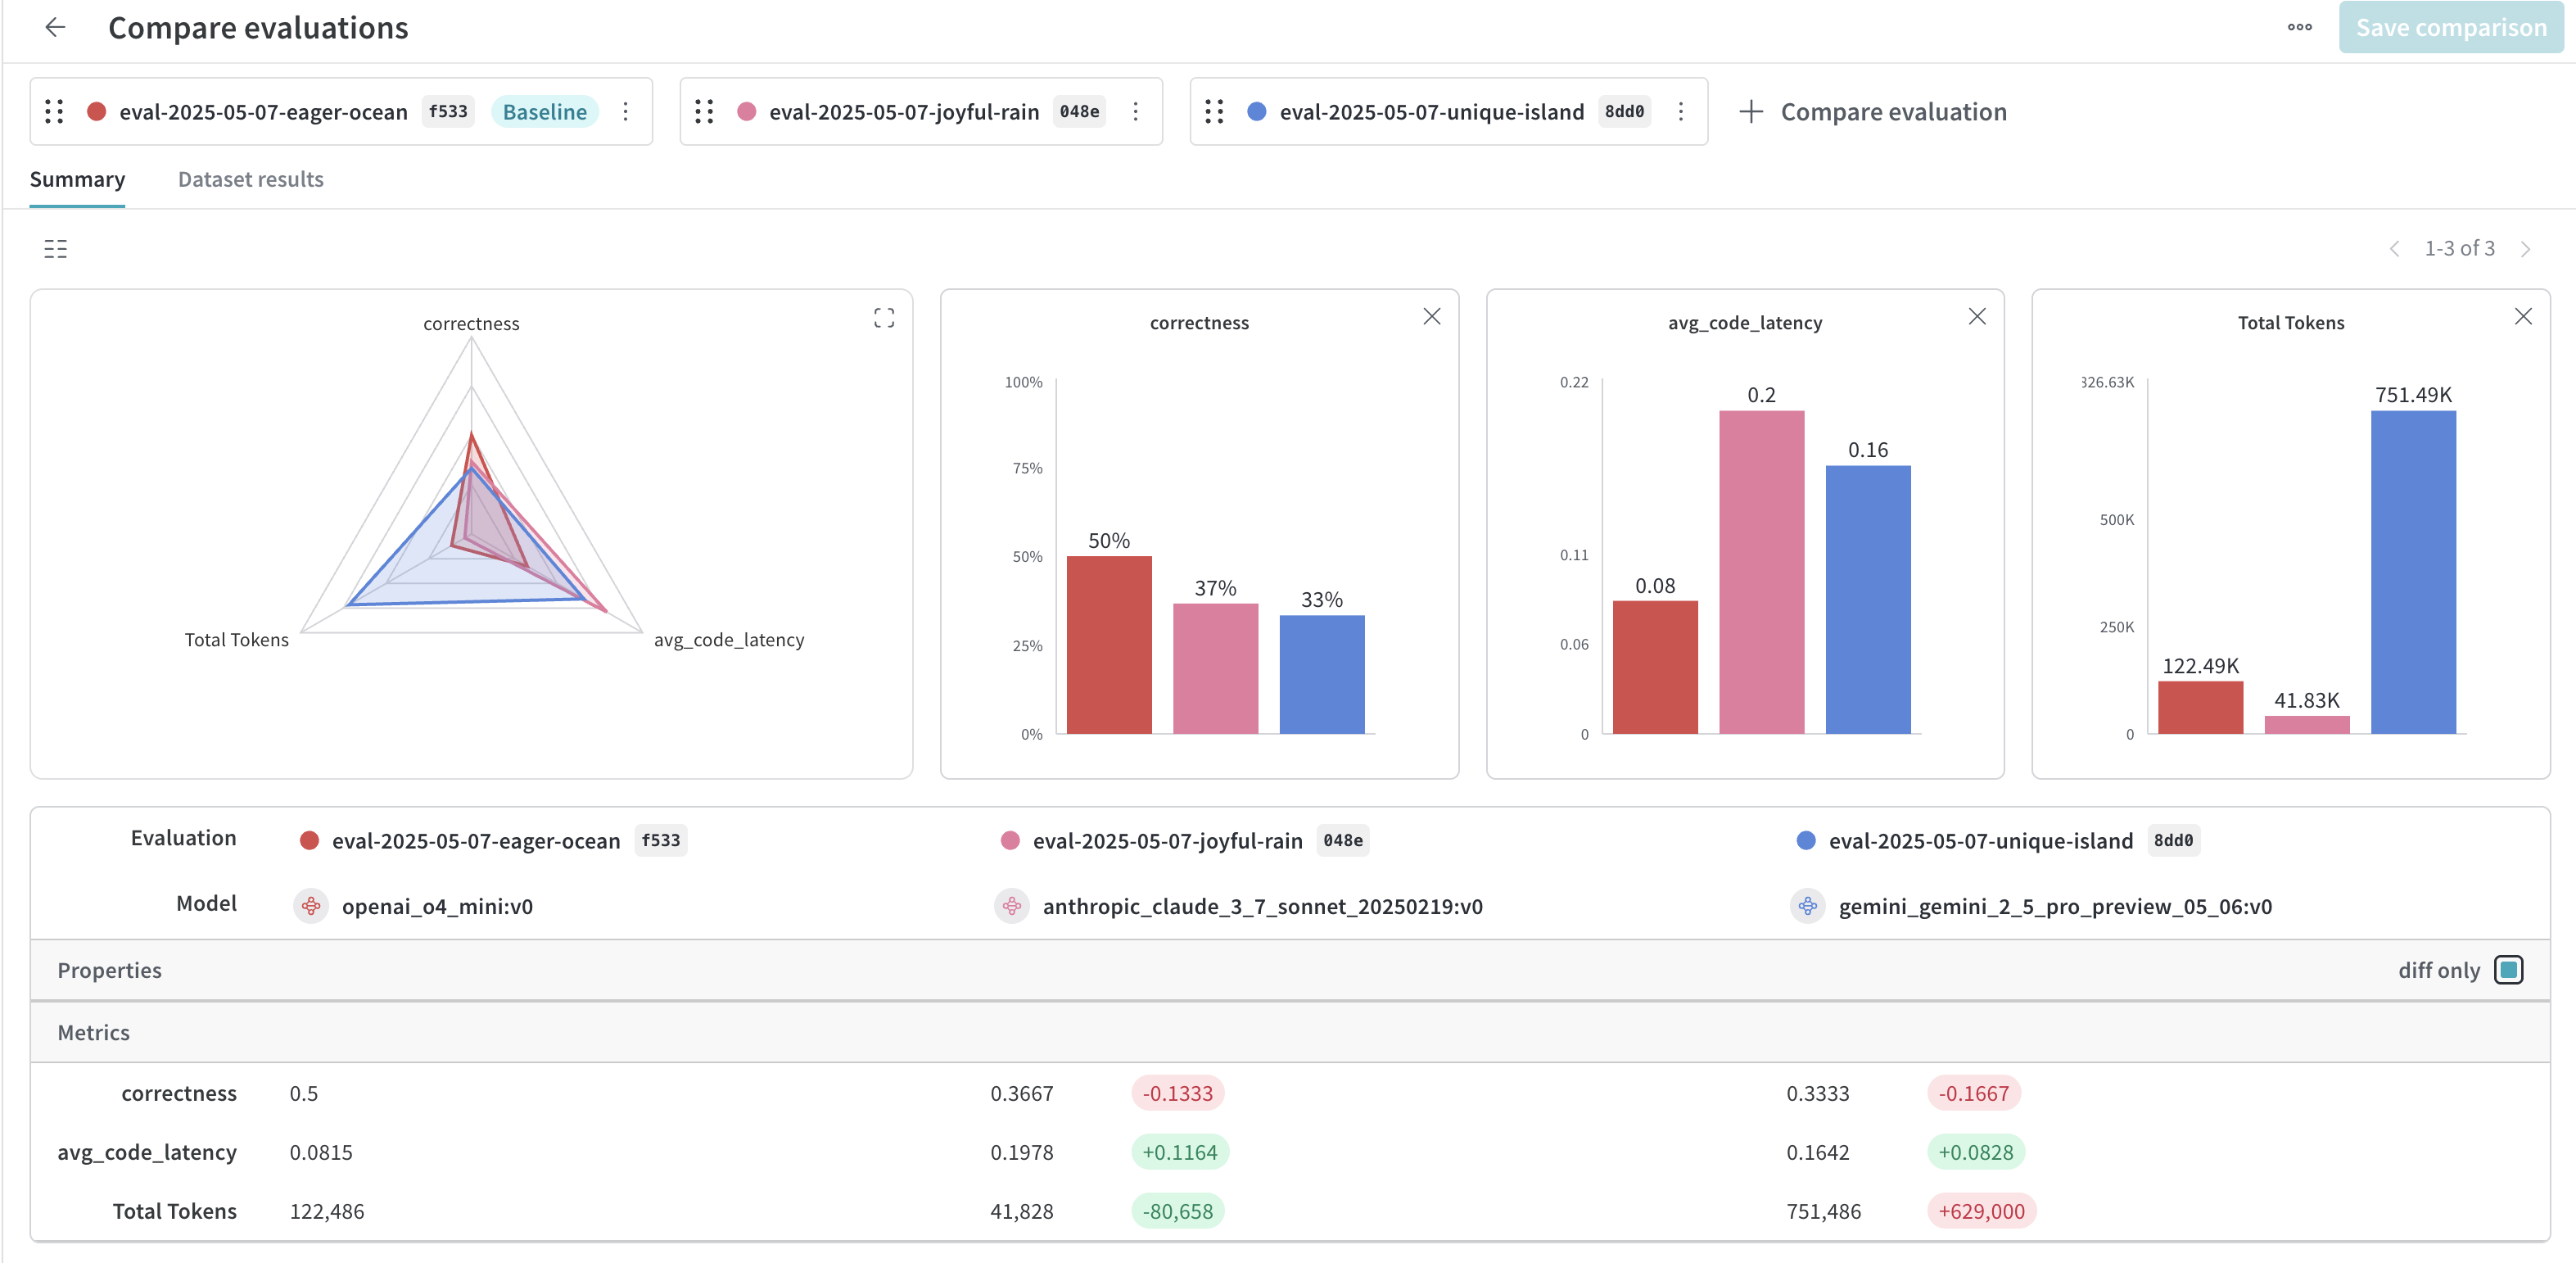
Weights & Biases is designed for the opposite regime. It assumes you are running a large number of experiments across many machines and that reproducibility is critical. Because every run is a structured object with attached metadata, it becomes possible to answer questions like why performance regressed, which data change caused it, or which hyperparameter sweep actually mattered. You can promote artifacts from research to production, audit model ancestry, and understand behavior across market regimes rather than just inspecting isolated curves.
Weights & Biases is the system that makes large-scale research possible in the first place. When experiments number in the thousands, datasets and simulators are constantly changing, and models evolve across regimes, having a complete, queryable history of what ran and why is what keeps the process sane. By treating experiments, artifacts, and metadata as first-class objects rather than loose files on disk, we turn raw compute into reliable research output and allows teams to move fast without losing track of reality.
Quant teams begin by building a strong data foundation for AI research. They ingest a wide variety of datasets, both structured and unstructured, including SEC filings, earnings calls, alternative data, market feeds, internal research, and proprietary signals. These datasets are transformed into features and representations suitable for training and evaluation.
Scaling experimentation is a central part of this research phase. Teams often train multiple model architectures in parallel, varying parameters, network architectures, and training strategies to evaluate which approaches perform best under different conditions. Multiple data modalities, such as text, structured time-series, or sentiment embeddings, are processed and tested using a variety of preprocessing pipelines and feature engineering strategies. Subsets of data may be sampled or augmented to stress-test model robustness, and synthetic datasets can be introduced to simulate rare market events.
High-throughput compute enables researchers to iterate quickly across this enormous search space. By running hundreds or thousands of experiments simultaneously, teams can compare architectures, training regimes, and input modalities, and identify which combinations yield the most predictive or robust models. This large-scale experimentation loop enables quantitative researchers to systematically identify the most effective strategies, uncover subtle patterns across datasets, and refine models efficiently without relying on single, narrow experiments.
For example, specialized finance-focused language models such as FinLLaMA and other Open FinLLMs can be pretrained and fine-tuned on proprietary financial data. Researchers can experiment with different model sizes, sequence lengths, tokenization strategies, or reinforcement-learning fine-tuning methods across multiple data types. This multidimensional approach to experimentation ensures that insights are drawn from both the structure of the data and the configuration of the model, thereby increasing the likelihood of identifying high-performing strategies in a complex market environment.
CoreWeave provides the kind of GPU infrastructure that makes large-scale Quant AI experimentation possible. Its GPU-dense clusters, fast provisioning, and high-bandwidth interconnects allow teams to train hundreds of models in parallel, run distributed simulations, and process massive datasets efficiently. By scaling compute on demand, CoreWeave enables researchers to explore a wide variety of model architectures, data modalities, and preprocessing strategies, turning raw insights into actionable models faster than traditional cloud or on-prem setups. In the context of modern quantitative research, this infrastructure transforms what would otherwise be an overwhelming problem into a tractable experimentation pipeline.
Modern quant research relies on two very different kinds of computing. On one side are large experimental jobs: training runs, simulations, and market replays that can demand dozens of GPUs at once and have to start together and run in sync. On the other side are the steady, day-to-day components of the research pipeline: data ingestion, preprocessing systems, feature stores, monitoring tools, and model-serving endpoints that need to stay up continuously. These two modes of work place very different demands on infrastructure.
Tools have emerged that specialize in each side. Systems such as Slurm focus on the computationally intensive experimental jobs, making it easy to request specific resources, launch coordinated multi-node runs, and prevent large experiments from interfering with one another. Systems like Kubernetes focus on the long-running services, providing a stable way to manage containers, keep services healthy, and scale them smoothly as workloads change.
Modern quant teams, however, rarely operate in one mode or the other, and they need both. They run massive bursts of compute for experiments while also relying on a set of always-on services that ingest data, track results, and deliver models. Running these two worlds separately usually means juggling clusters, duplicating resources, or wasting GPUs when workloads shift.
CoreWeave addresses this friction by operating a unified scheduling environment through SUNK (Slurm on Kubernetes), allowing experimental jobs and long-running services to draw from the same GPU pool.. Heavy experimental jobs can leverage Slurm’s coordination capabilities, while surrounding services run under Kubernetes and both draw from the same GPU pool. This gives research teams a unified setup that adapts as their work shifts between exploration, simulation, and deployment, without forcing them to choose one style of infrastructure over the other.
As quantitative research scales, the volume of experiments grows fast. Models are retrained, parameters shift, datasets evolve, and simulation settings change from run to run. Without a reliable way to track all of this, quant teams end up with spreadsheets, scattered notes, and folder structures that slowly drift out of sync with the actual work. That makes it hard to reproduce results, compare approaches, or understand why one version of a strategy performed differently from another.
Weights & Biases fixes this by acting as the system of record for the entire research workflow. It captures hyperparameters, metrics, artifacts, and model lineage in one place so teams can retrace every step without guesswork. Instead of relying solely on loss curves, researchers can monitor signals such as Alpha Decay or shifts in feature importance over time, thereby building a clearer picture of how ideas evolve. W&B Experiments becomes the anchor that keeps long research cycles coherent, even as the number of runs climbs into the thousands.
Once a model shows predictive power, the real test begins: does it actually produce profitable trades in a live market? High accuracy on historical data can be misleading. Execution costs, slippage, liquidity constraints, and volatility can all turn an apparently strong model into a money-losing strategy.
Backtesting is the stage at which predictions are evaluated against economic reality, and researchers evaluate strategies using financial metrics such as the Sharpe Ratio, Sortino Ratio, and Maximum Drawdown, rather than relying solely on statistical measures such as MSE or Cross-Entropy. These metrics reflect not only whether a model predicts correctly but also whether it can survive and generate returns under real-world conditions.
Predictive accuracy on its own is a weak test for a trading model. A model can correctly forecast price direction more often than not and still lose money if it trades too frequently, sizes positions poorly, or takes asymmetric risks. Traditional ML metrics like MSE or Cross-Entropy measure how close predictions are to labels, but they say nothing about how those predictions translate into returns once capital is at risk.
PnL is the starting point. It measures the total profit or loss generated by a strategy over time, after accounting for costs. While PnL tells you whether the strategy made or lost money, it does not describe the path taken to get there. Two strategies can end with the same PnL while exposing very different levels of risk along the way. Risk-adjusted metrics fill that gap.
The Sharpe Ratio measures how much return a strategy generates per unit of volatility. It penalizes strategies that achieve gains by taking large, unstable swings in value. A high Sharpe indicates that returns are relatively consistent rather than driven by a small number of lucky outcomes. However, it treats upside and downside volatility equally, even though traders typically care more about losses than gains. The Sortino Ratio addresses that limitation by focusing only on downside volatility. It measures the extent to which a strategy delivers returns relative to harmful fluctuations, making it better suited for evaluating strategies with asymmetric return profiles. Strategies that generate steady gains with occasional large losses score poorly under Sortino, even if their average returns look strong.
Max Drawdown captures a different risk altogether: the worst peak-to-trough loss experienced over the backtest period. It answers a practical question that accuracy and Sharpe ratios ignore: how much capital could be lost before the strategy recovers. Large drawdowns can trigger margin calls, risk limits, or investor withdrawals, even if the strategy eventually recovers. This makes drawdown one of the most important constraints in real trading environments.
Together, these metrics shift evaluation from prediction quality to economic viability. They force models to demonstrate not just that they can forecast signals, but that they can do so in a way that controls risk, limits losses, and produces returns that can realistically be deployed with real capital.
Financial markets change over time. Volatility rises and falls, relationships between assets shift, and trading behavior that worked in one period can weaken or disappear in another. That makes financial data very different from the kind of data most machine learning methods assume. Techniques like K-Fold cross-validation treat all observations as interchangeable and randomly shuffle the data before training and testing. In a time-series setting, this breaks the natural order of events.
When you shuffle market data, information from the future can accidentally influence the model during training. This is called look-ahead bias. The model appears to perform well because it is indirectly using data that would not have been available at the time the decisions were made. In live trading, such information is not yet available, so the results are unrealistically optimistic.
Walk-forward optimization avoids this problem by respecting time. The model is trained on a fixed historical window, then tested on the immediately following period. After that, the window moves forward and the process repeats. At no point does the model see future data while training. This preserves chronology, removes look-ahead bias, and gives a clearer picture of how a strategy would have behaved as market conditions evolved.
A common starting point for backtesting is to simplify market data into “bars,” which summarize price movements over fixed periods, like one minute, five minutes, or one day. Each bar records the opening price, the highest and lowest prices during that period, and the closing price. Using bars makes calculations simpler, but it hides what actually happened within the period. If a strategy places multiple trades during that window, a bar-level backtest cannot capture the sequence of events or the timing of price movements.
Vectorized backtesting applies calculations across these bars in bulk. It is fast and convenient, but it assumes that trades execute instantly at the recorded prices. This simplification ignores key market realities: whether there is enough liquidity to fill an order, whether large trades move the market price, and how slippage—the difference between expected and actual execution prices—affects profitability. A strategy can look profitable on a vectorized backtest but fail when exposed to real-world trading mechanics.
Event-driven backtesting overcomes these limitations by simulating the market in the exact order events occurred. Rather than using aggregated bars, the simulation feeds every price update, trade, and change in the order book to the strategy sequentially. This allows researchers to observe how trades actually execute in real time, including partial fills, slippage, and the impact of trade size on prices. It also captures the effects of sudden market events, news bursts, volatility spikes, and liquidity shocks. For strategies that rely on timing or frequent trading, event-driven simulation provides a much more realistic picture of potential performance.
By combining financial metrics, walk-forward validation, and event-driven simulation, backtesting provides a rigorous means of assessing whether a strategy can withstand real market conditions. It exposes weaknesses that purely predictive models might miss, evaluates the costs of execution, and ensures that only strategies robust enough to handle the complexity of real markets advance to deployment.
Even the most sophisticated backtests cannot guarantee that a strategy will succeed in live trading. Historical data only reflects the conditions that occurred in the past, and the market can change in ways no backtest can anticipate. Models that perform well in backtests may fail when market regimes shift, volatility spikes, or liquidity patterns change.
Overfitting is a persistent danger: a strategy may appear profitable simply because it has memorized quirks of the historical data rather than capturing genuinely predictive signals. Researchers must remain cautious and avoid interpreting strong backtest results as proof of future performance.
Backtesting must go hand in hand with careful risk assessment. Metrics such as the Sharpe Ratio, Maximum Drawdown, and Sortino Ratio indicate performance relative to volatility, but they do not capture all forms of exposure. Teams need to simulate scenarios such as extreme market stress, sudden liquidity crises, or unexpected correlations between instruments. Risk limits and guardrails should be built into strategies before live deployment. Position sizing, stop-loss rules, capital allocation, and drawdown limits are critical tools for preventing catastrophic losses, even when historical backtests appear strong.
As models become more complex and more central to trading decisions, firms also have to manage model risk alongside market risk. In regulated environments, this discipline is formalized under Model Risk Management frameworks, often guided by standards such as SR 11-7. These frameworks emphasize that models should be documented, independently validated, and monitored over time. Performance alone is insufficient; teams must be able to explain how a model works, the assumptions on which it relies, where it may fail, and under what conditions it should be restricted or shut down. This adds an additional layer of guardrails that sit on top of traditional risk metrics, ensuring that models remain controlled and auditable as market conditions evolve.
Backtesting also requires attention to operational realities. Execution delays, slippage, and market impact can all erode returns, and even event-driven simulations are approximations of real markets. Strategies that trade at high frequency or in illiquid markets require additional caution, as backtests may underestimate costs or the difficulty of entering and exiting positions. Researchers often run multiple rounds of stress tests, scenario analysis, and sensitivity checks to understand the boundaries of strategy performance. Ongoing monitoring is especially important, since shifts in data distributions or market structure can quietly invalidate assumptions that once held.
Ultimately, backtesting is a necessary but not sufficient step. It provides a controlled environment to evaluate ideas, identify weaknesses, and refine strategies, but it cannot remove uncertainty. The combination of realistic simulations, chronological validation, financial risk metrics, and formal model governance gives teams the best chance of moving from promising historical performance to strategies that can survive real markets.
The execution layer is evolving as AI moves beyond simple prediction into reasoning over sequences of market events. Traditionally, trading AI has focused on forecasting: estimate returns, rank assets, generate signals, then let deterministic rules convert those signals into trades. While effective in certain contexts, these systems are limited. They cannot dynamically reason about sequences of events or adapt to changing market conditions the way humans do.
Instead of following a predefined strategy, future trading agents will likely be able to explore near-unlimited strategies and discover entirely new patterns of behavior. We are entering a period where models can do more than predict. Modern AI agents can ingest diverse streams of information, maintain internal state, and reason about sequences of events. Instead of asking “what is the expected return over the next interval,” the system can evaluate questions more closely aligned with how human traders think: what just happened, what it implies, what risks it introduces, and how exposure should change as new information arrives. This does not mean intuition or gut feelings; it means explicit chains of logic applied consistently at machine scale.
Emerging LLM-powered trading agents operate within this reasoning space. They explore potential actions constrained by objectives, risk considerations, and operational limits, allowing them to adapt not just parameters but the structure of decision-making itself as conditions evolve. Equipped with general-purpose reasoning capabilities, these systems can weigh competing objectives, anticipate consequences, and update internal beliefs as new information arrives. They can integrate news, macroeconomic events, and intra-day market dynamics to adjust positions in ways that traditional predictive models cannot.

A key mechanism for learning in these agents is reinforcement learning combined with LLM reasoning. The LLM generates potential actions or trading intents based on the market state and various signals, while a simulated environment evaluates the outcomes. Agents receive a reward signal, typically combining realized PnL, risk-adjusted returns, and penalties for constraint violations, which guides the agent to reinforce profitable or low-risk behaviors. This allows strategies to emerge from economic consequences rather than purely predictive accuracy.
Training occurs primarily in simulation. Agents explore “what-if” scenarios, testing responses to volatility spikes, news events, and liquidity constraints. Conditional policies emerge naturally, for example, reducing exposure during periods of high volatility or prioritizing capital preservation when signals conflict. These behaviors arise from the interaction of reasoning and reward-guided learning, not from hard-coded rules.
As trading systems move from static signals to reasoning agents operating in real time, inference behavior becomes just as important as training scale. These agents are not making microsecond market-making decisions; they operate on seconds-to-minutes timescales where consistency matters. When a model is reacting to a breaking news headline, a macroeconomic release, or a sudden regime shift, variability in inference latency can translate directly into unpredictable behavior.
CoreWeave’s bare-metal infrastructure provides deterministic performance for this meso-scale execution regime. Eliminating noisy neighbors, virtualization overhead, and unpredictable scheduling delays ensures consistent inference timing under real-world conditions. This allows reasoning agents to behave as intended by evaluating sequences of events, updating internal state, and adjusting exposure in a controlled, repeatable manner as new information arrives.
For LLM-powered trading agents that integrate news, macro data, and intra-day signals, this consistency is especially valuable. Decisions are often coupled across time: one inference informs the context for the next. Bare-metal execution ensures that these chains of reasoning are not distorted by infrastructure-induced jitter, helping teams deploy agents whose behavior in production closely matches what they observed in simulation. In practice, this turns infrastructure into a source of reliability rather than uncertainty, supporting the transition from research agents to live trading systems without surprises.
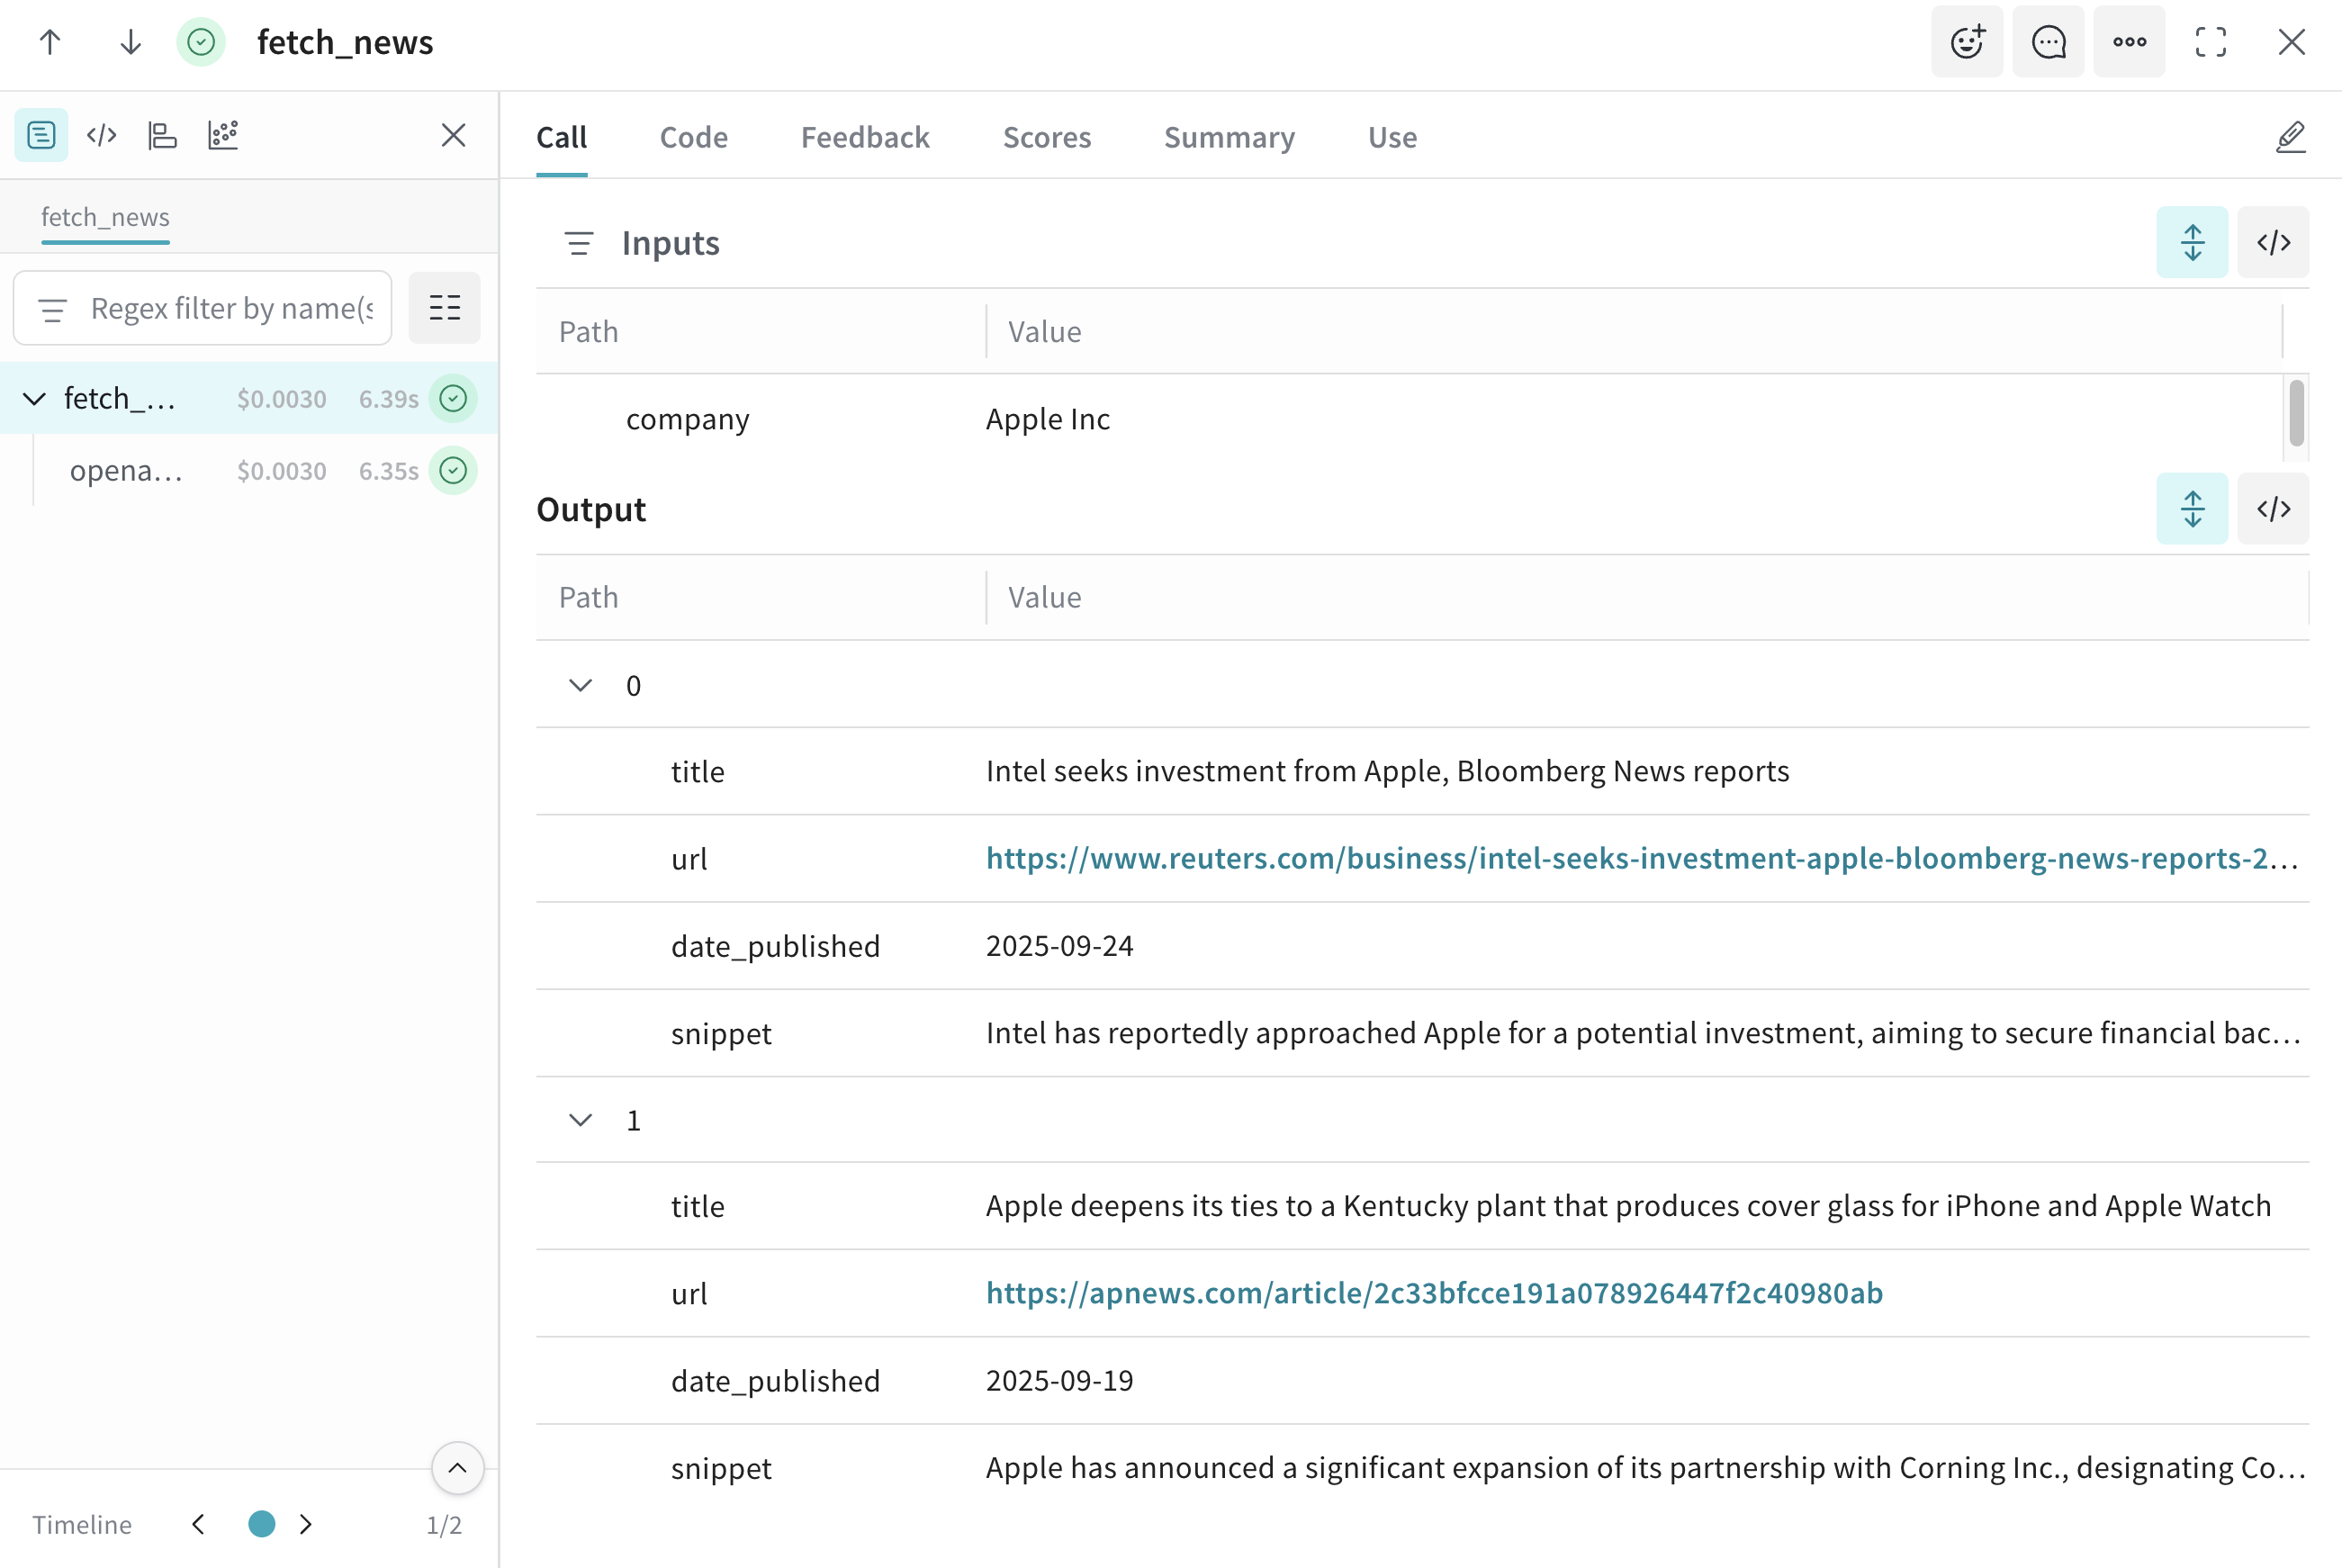
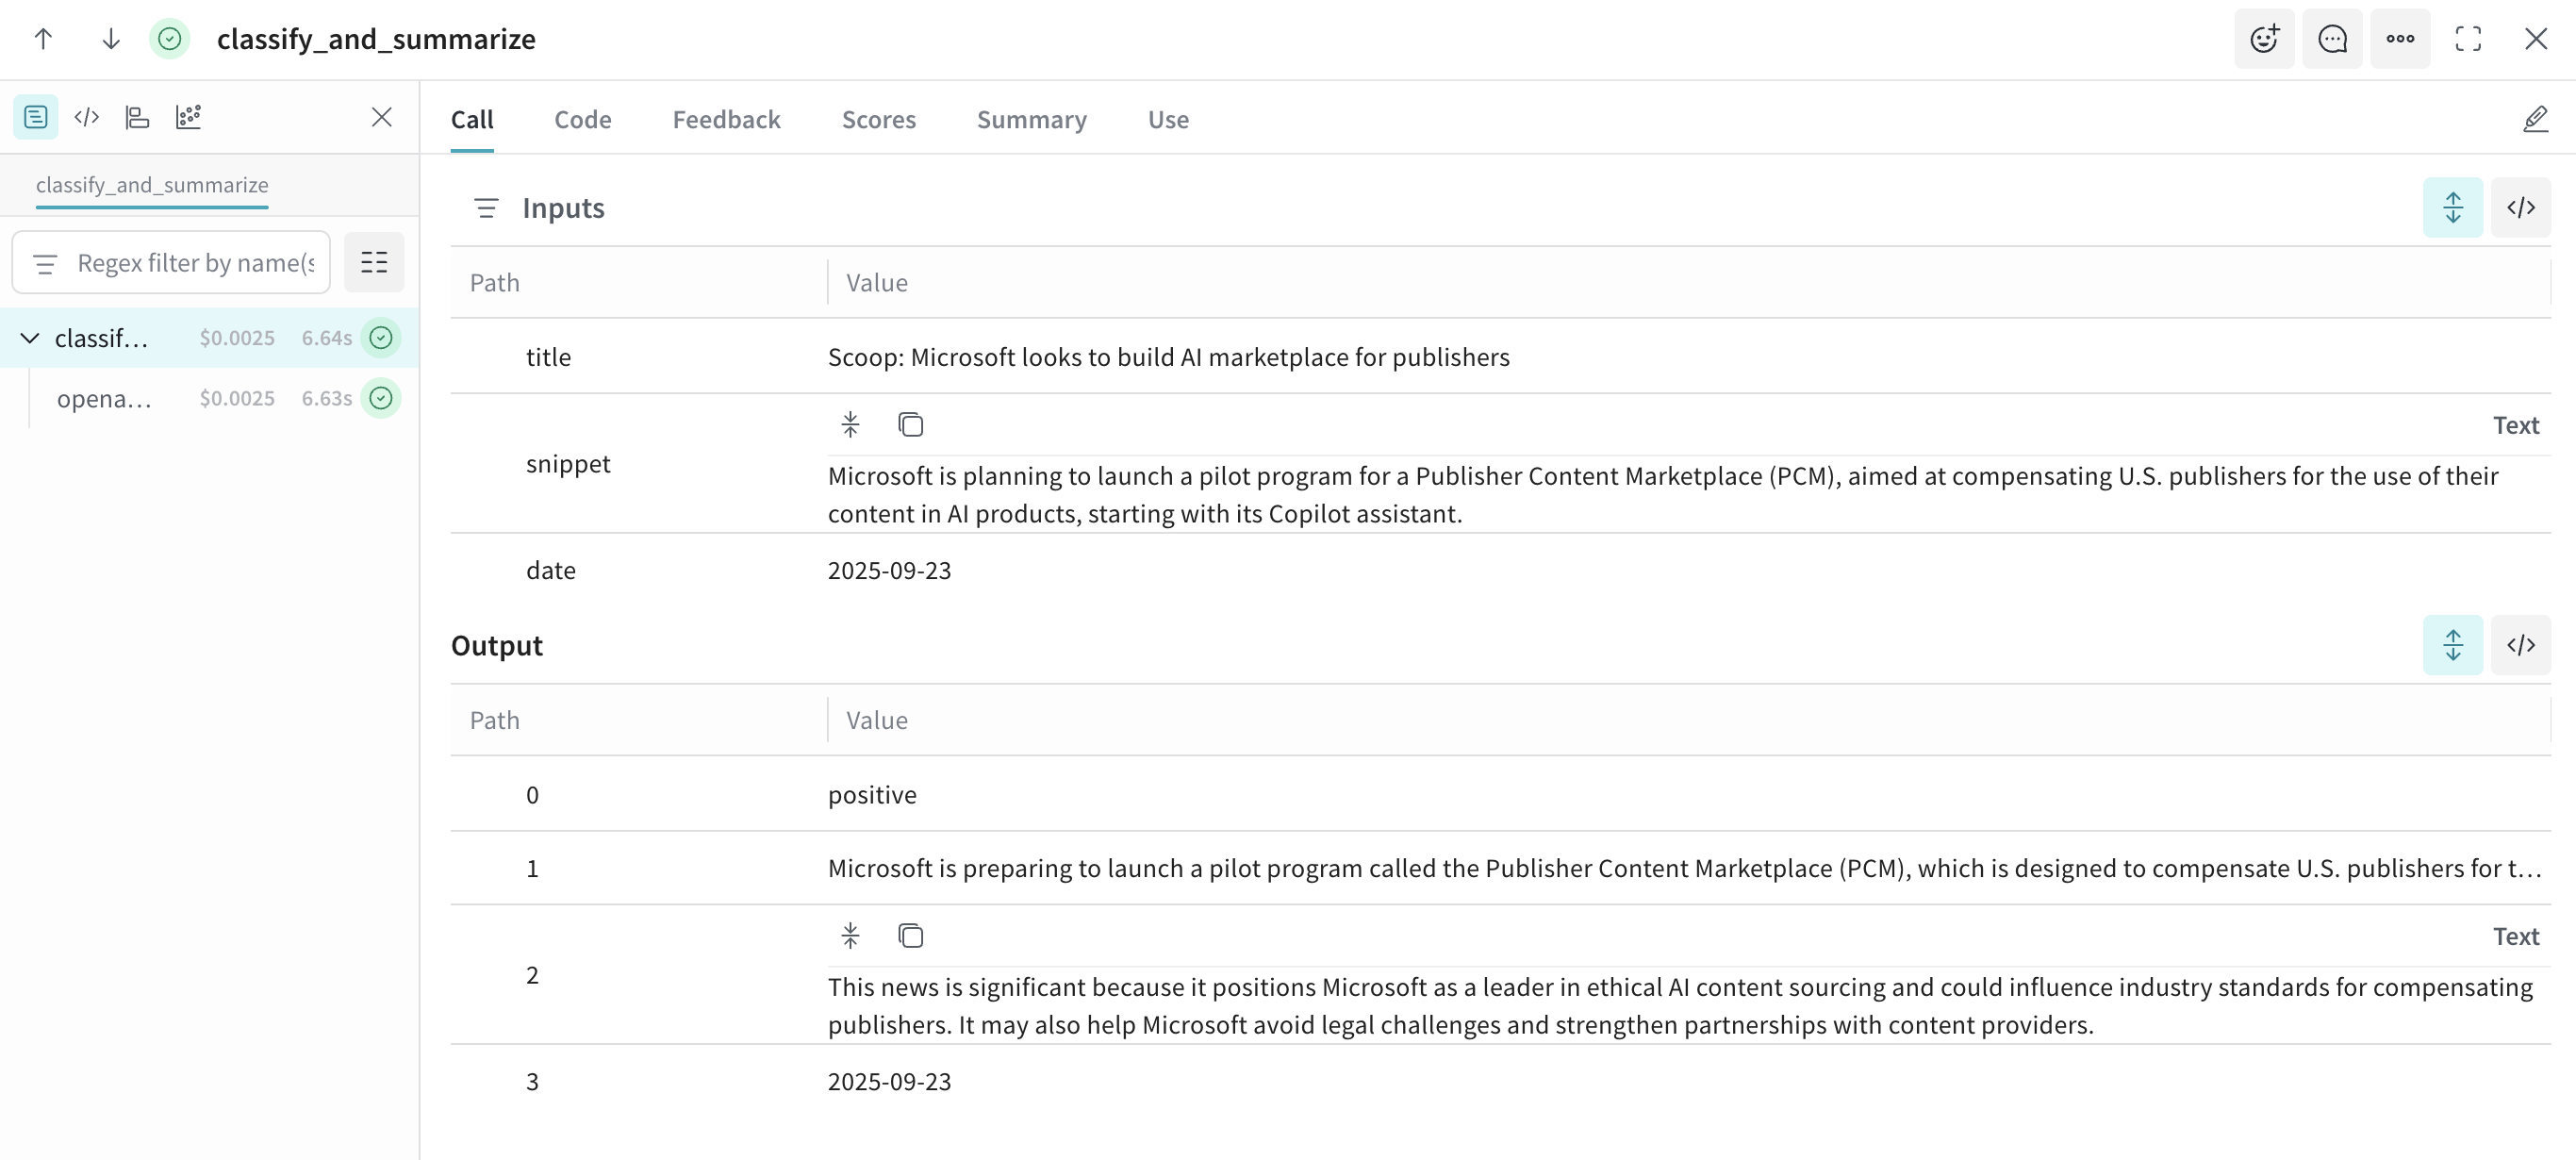
Tracing the decision process is equally important. Tools like W&B Weave allow researchers to record the full chain of LLM reasoning, capturing intermediate outputs, context embeddings, and decision rationale. This trace-level introspection is vital for understanding why an agent took a particular action, debugging unexpected behavior, and improving reproducibility across experiments. By making the reasoning process transparent, teams can refine agent policies safely, evaluate performance under varying conditions, and build confidence in the system’s behavior before deploying in the real world.

While promising, automated trading these methods remain experimental. Most work occurs in simulation or backtests, and the transition to live trading introduces additional challenges, including slippage, latency, liquidity, and regulatory compliance. Nevertheless, the combination of LLM reasoning, reinforcement learning, robust bare-metal infrastructure, and traceable decision logs represents a forward-looking framework for more adaptive and intelligent execution systems.
After execution, attention shifts to governance, model validation, and continuous oversight. Trading strategies, including those powered by AI systems, require rigorous post-trade analysis to ensure performance, compliance, and long-term reliability.
Tools like W&B Registry link production models to their exact training artifacts, code versions, datasets, and responsible team members. This level of traceability is required for formal model risk management and aligns with regulatory guidance such as SR 11-7, which governs model validation, documentation, and ongoing oversight in financial institutions. By maintaining clear lineage, teams can review how a model evolved over time, understand why specific decisions were made, and provide defensible evidence during internal reviews or external audits.
Even strong models can change in performance as markets evolve. Post-trade monitoring ensures that predictions remain reliable and that models continue to behave as expected. Teams track how well outputs align with real outcomes, watch for shifts in market conditions or input data, and detect patterns of drift over time. Weights & Biases’ tools provide a centralized location for tracking calibration metrics, performance over time, and comparisons across experiments. When a model succeeds in live trading, teams need a complete historical record of the datasets, parameters, code, and decisions that produced that outcome so the process can be studied and repeated. When a model fails, the same record enables tracing regressions, identifying broken assumptions, and understanding what changed. Without centralized tracking, success becomes hard to reproduce and failure becomes hard to explain.
Taken together, model registries, calibration monitoring, and historical experiment tracking close the post-trade feedback loop. Insights from production performance flow back into research, retraining, and risk controls. Models remain auditable, interpretable, and continuously improved rather than opaque and fragile. This governance loop enables quantitative teams to scale AI-driven strategies responsibly while remaining aligned with operational discipline and regulatory expectations.
Weights & Biases supports fully self-hosted deployments, meaning the entire experiment tracking, model registry, and evaluation stack can operate entirely within an organization’s private network. Teams retain full control over data, model artifacts, and training logs while still orchestrating compute-intensive tasks across on-premises and cloud environments. Consistent tooling ensures that workflows, experiment metadata, and model versioning remain fully traceable regardless of where computations occur. Fine-grained access controls, containerization, and automated synchronization preserve security and reproducibility across distributed environments.
Organizations often face a trade-off between maintaining strict control over sensitive data and scaling compute resources for large AI workloads. Hybrid MLOps frameworks enable critical datasets and proprietary models to remain on-premises, while allowing non-sensitive or overflow workloads to leverage external secure GPU clusters such as CoreWeave for distributed training, high-throughput simulations, or reinforcement learning experiments. This setup allows teams to fully exploit scalable compute resources without compromising data privacy or regulatory compliance.
By integrating self-hosted Weights & Biases, secure compute infrastructure, and hybrid MLOps, organizations can scale experimentation and model development efficiently while maintaining full oversight of proprietary data and models. This approach ensures AI pipelines remain auditable, reproducible, and compliant, enabling teams to iterate quickly, innovate safely, and maintain operational control over critical trading or research workflows.
The evolution of quantitative trading reflects a broader shift from microsecond-level signal chasing to understanding market structure over longer horizons. AI and ML have transformed the landscape, enabling teams to handle massive datasets, run high-throughput simulations, and explore strategies that were previously infeasible. But advanced infrastructure alone is not enough. Coordinated compute, event-driven backtesting, rigorous experiment tracking, and careful risk management are all essential to turning predictions into actionable strategies.
Modern quantitative workflows increasingly rely on reasoning-enabled AI agents, reinforcement learning, and traceable execution systems. These approaches promise more adaptive and intelligent decision-making, enabling navigation of complex, dynamic markets. At the same time, robust governance, post-trade monitoring, model registries, and regulatory-aligned frameworks like SR 11-7 ensure that performance remains interpretable, auditable, and controllable.
The combination of scalable GPU infrastructure, centralized experiment management, and advanced AI reasoning forms a full-cycle pipeline: research, execution, and governance. By integrating these elements, quant teams can iterate faster, explore more sophisticated strategies, and manage risk effectively. While the field is still in early stages, the tools and frameworks emerging today lay the foundation for a future where AI agents not only predict markets but also reason about them, learn from outcomes, and operate within disciplined, auditable systems. The result is a quantitative trading ecosystem that is both powerful and responsible, capable of scaling intelligence without sacrificing oversight or security.
Want to find out more
If your team is struggling to track thousands of experiments or waiting in queue for GPU resources, it’s time to upgrade your stack.
See how Weights & Biases provides the system of record for your research, while CoreWeave delivers the bare-metal performance your agents need to execute in real-time.